The Low-Efficiency Penalty
“Dollar per watt” can be a misleading number. For those who aren’t familiar, if you sell a 150-watt module for $300, that’s $2/watt. Pretty simple.
However, even though it’s a common way to talk about pricing, it leaves a lot out of the equation. In particular, it doesn’t factor in the efficiency of the module. Lower-efficient modules require more space for the same amount of power output. That means more racking to hold them up, more labor to install them, and more land. I’ve heard people talk about a “penalty” for low efficiency, so I wanted to calculate what that would look like.
I put together a very simple model of a PV system. The PV modules, inverter, and wiring are all defined on a $/watt basis, while the racking and labor are defined on a price per square meter of solar modules. So, with lower efficiency modules, you need more of them – and the model grosses up the racking and labor in proportion.
Let’s work through a quick example. With the assumptions above, a developer would earn a 10% return if he installed 1MW of 15% efficient modules while paying $2.35/watt for the modules. On the other hand, he would also earn a 10% return if he installed 1MW of 10% efficient modules, paying $2.05/watt. In other words, he needs a $0.30/watt discount for the 10% efficient panels, because he needs to use that money to buy the extra racking and pay for the extra labor.
You can plot these points on a curve. Below, I show all the points at which a developer is indifferent, for efficiencies ranging from 5% to 20%. (Note that I flipped the price axis, so that the numbers get smaller as you go up. The consulting rule of thumb is that “good” is always up and to the right, and in this case, “good” is cheap.) The two points in my example above are shown as the red and purple boxes.
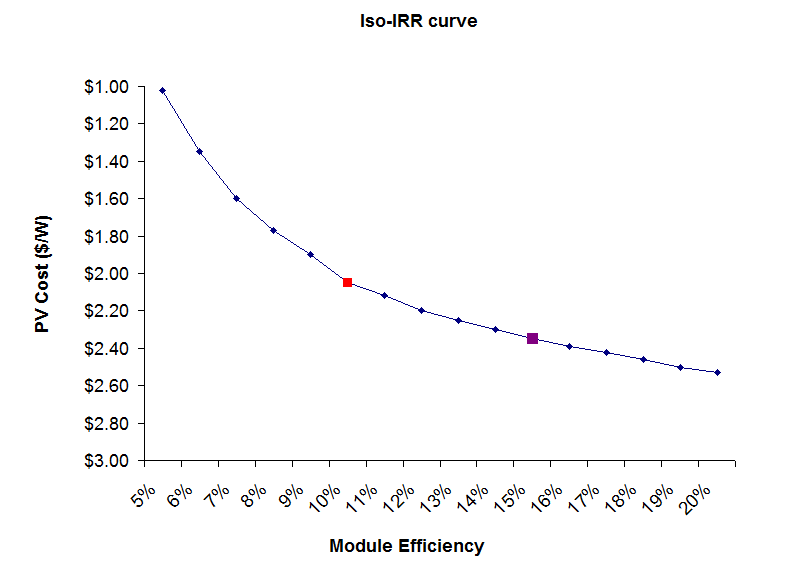 The interesting here is that the curve gets steeper the further to the left you go. The difference between 20% and 15% efficiency is only $0.16/watt. Between 15% and 10% it’s $0.35/watt. Between 10% and 5%, the difference is a full $1.00/watt.
This is a big reason why so many people are pessimistic on amorphous silicon. With expected efficiency of only around 5-7%, they start with a $0.75 to $1.33 penalty versus a silicon panel that gets 15% efficiency.

This is very cool. Datacenters followed this trend. At first it was all about $/CPU cycle, but starting with Google everyone figured out that power, space and cooling actually had bigger impact than initial capital cost and so all the metrics went haywire. For the most part now people talk about CPU cycles / watt, but space is still a big concern. Lots of interesting things going on in cooling too.
So if you tried to create a holistic metric for solar “yield” what would it be? $ / watt / sq ft? Labor and racking costs make the mind boggle a little. In data centers the “racking cost” pretty much comes out in the noise but perhaps that’s not true in solar. (Much larger surface area, heavier equipment, etc…)
Very cool
Hey Oliver, you’re right, the correct view would take into account a bunch of factors in PV pricing. The components of this “holistic metric” would be:
Power density/efficiency (for the reasons outlined above)
Thermal coefficient: the speed with which each semiconductor degrades with temperature is a big deal when these are sitting out in the hot sun
Low-light performance: different semiconductors have different performances in low-light, when the effective spectrum tends to be more to the red side
Voltage: this dictates the electrical system design, which can change the system cost pretty significantly
And then there are a host of physical attributes, such as how easily the modules can be mounted.
The only reason this can’t be boiled down to a single equation is that each installation is very unique – depending on whether you are on a residential rooftop, a commercial rooftop, or a utility-scale, ground-mounted system. So the ‘coefficients’ would be very different depending on where you are/what you’re building. A solvable, but complex, problem.
But I would certainly argue that as the market matures, the sophistication here will go up. We have years of learning ahead of us.
Paul,
First, nice blog!
I really like the IRR presented this way to show the system trade off.
Just nerding out here:
Roughly speaking
LCOE ~ [ PanelCost + OtherCost ] /[ NPV of Energy]
Where OtherCost scales with efficiency approximately as Constant/Eff (ignoring inverter and some other fixed costs in $/W terms).
Very roughly speaking, given a fixed debt/equity split and kWhr/kW (independent of efficiency), the IRR is a function of the difference between the LCOE and the selling price of electricity.
Having constant IRR then means
d/dEff [ PanelCost + Constant/Eff ] = d/dEff [ LCOE ] ~ d/dEff [ IRR ] = 0
then d(PanelCost)/dEff = Constant/Eff^2
or Delta(PanelCost) = Constant * Delta(Efficiency)/(Efficiency^2)
So a 1% absolute increase in efficiency at low efficiency means a much bigger increase in panel cost than at high efficiency.
So if you’re a panel manufacturer, improving efficiency at the low end for a fixed cost has a huge payoff – something you kind of address in the Si related article.
-i
Hey man – congrats on one-upping me on the quant! I’m actually going to take the iso-IRR one step further in my next post, but you’ve already shown part of the answer: manufacturers are always incented to increase their power density (efficiency), but this is most extreme at the low end of the efficiency range.
[…] pt 3: Sunlight Posted in Solar by Paul Grana on June 6, 2010 The Iso-IRR curve seems to be a popular way to think about different solar plants. So I wanted to use it to look at […]
[…] However, the technology already has a few black eyes. Sunfilm filed for bankruptcy, and eventually merged with Sontor. Applied Materials is rumored to be scaling back their business, and considering abandoning it. This is led some people to question whether this technology will even become obsolete. Part of the problem is that amorphous’ low efficiency forces them to pay a penalty, as I explain here. […]