Five (underrated) things that make America great
After a divisive election season, it’s worth a moment to remember what makes our country great. If you ask the average person what makes America exceptional, the answers are usually, “Our freedom & human rights,” “Our democratic system,” or “Our right to carry a gun.” But there are a lot of behind-the-scenes factors that are also critical for making this country special, particularly when it comes to entrepreneurship. Here are my favorite five.
1) Bankruptcy laws
Our bankruptcy laws are very lenient for the debtor (the person or entity in debt). In corporate law, for example, the primary objective of Chapter 11 is to keep the company going, allowing it to renegotiate many of its contracts and survive intact. By contrast, the British common law system (on which many other countries are modeled) is extremely harsh on debtors – its objectives are to get the creditors their money back as quickly as possible.
This is a big factor in encouraging the entrepreneurship and risk-taking that has made this country such a dynamic, vibrant place to do business.
2) Research dollars going to young researchers
The American university research system is built around a very distributed research model: most PhD students are encouraged to perform their own research, and will generally receive funding in order to perform that research.
By contrast, European universities are largely based on a more hierarchical German model: PhD students are expected to perform research in the lab of an established professor, and most of the research is funneled to the large research labs under these professors.
There are pros & cons of each approach, but I like the American philosophy: it encourages young researchers to pursue new and novel ideas, which leads to more innovation (as well as more failed ideas).
3) Faster depreciation schedules
The US has the highest marginal corporate tax rate among the G20, but also has the fifth-lowest effective taxes. A big reason for this is that we give a lot of tax breaks for investment, particularly accelerated depreciation on capital expenditure.
This, I would argue, is why a lot of our everyday facilities (office space, restaurants, stores, etc.) are so nice, not to mention the things we don’t see, like industrial/manufacturing equipment or distribution systems.
This has an indirect benefit for product innovation. When the manufacturers or store owners are on a 5-year purchase cycle rather than a 10-year cycle, manufacturers will have a higher ROI from investing in next-gen technologies.
4) At-will employment
At a time when unemployment is so high, the ability to easily fire employees is a bittersweet virtue. But it’s much better than the alternative, such as in France, where it is extremely difficult to fire employees. In the US, our companies are more nimble. This is critical when the world economy changes so quickly., And a counter-intuitive benefit is that employers will more readily hire people when they know the decision is not a multi-year commitment. When the economy eventually turns around, this factor should be a big driver of future hiring.
5) Right-to-work laws (CA only)
California has a strong track record of preserving an individual’s right to work –this usually means corporate non-compete agreements are rarely enforced. Many successful Silicon Valley companies are built by people who leave their employer to try and “do it better.”
Again, this is a law that helps innovation – encouraging individual entrepreneurs to pursue the best ideas rather than funneling the ideas into R&D departments of large corporations. In some cases, the corporation can embrace this model, dubbed by some as “open innovation”. The result is more experimentation, and more innovation.
Further reading: http://www.amazon.com/Open-Innovation-Imperative-Profiting-Technology/dp/1422102831
Conclusion
Based on the above, everyone has the ability to live the modern American dream:
- Go to a research institution and fund your own research project
- Work for a big company while you’re refining your own ideas in your garage – and leave the large company as soon as you’re ready to strike out on your own
- Hire people freely, not worrying about whether you need them for life
- Pursue a risky opportunity, knowing that failure and bankruptcy will not ruin you personally
On Free Agency and Playoffs
So, after looking at how sports teams’ records impact their odds of winning, I wanted to use that same approach to answer a couple more questions about sports.
Did free agency change the NFL?
When the NFL instituted modern free agency between 1987 and 1992, the parity in the NFL increased, making good teams less dominant and upsets more likely. This can be seen in the chart below, where the higher red curve indicates fewer upsets before free agency:

Do teams “turn it on” in the playoffs?
In the playoffs, good teams are more dominant. Or, in other words, they are trying harder than they do in the regular season. We can see this in the NBA:

And the NHL:

While it isn’t necessarily surprising to see the trends in the above charts, they do sort of prove that teams sometimes mail it in during the regular season.
(Note: I didn’t do this for baseball or football, as they don’t have enough playoff games to run the above analysis.)
Any Given Sunday – Part II
So, how much randomness is there in sports?
Last week I tried to answer this by looking at the differences between the win totals of the good and bad teams. But that doesn’t tell the whole story, because it ignores who those wins came against.
Instead, it’s more interesting to ask the question: if one team is better than another, what is the probability that the better team wins?
Now, there’s no perfect way to define a “better team,” but we can use the team’s winning percentage as a decent estimate[1]. The difference between two teams’ winning percentages then gives us their mismatch in talent. See the chart below (dashed lines indicate low base sizes):

It’s no surprise to see the lines going up and to the right – a bigger mismatch between teams should lead to greater odds of winning.
But the parity in the NHL and MLB is pretty striking. This chart implies that in those sports, even in the most lopsided games, the stronger team could only be expected to win about 60% of the time[2].
This chart can also spur some interesting debates about why these charts look the way they do. I don’t have the answers, but a few hypotheses:
1) There is certainly some inherent randomness, which varies by sport. I think this shows pretty conclusively that baseball and hockey have a greater proportion of randomness than football and basketball.
2) The final score values also have some impact. Consider that a typical hockey score is 2-1, versus a typical basketball score of 90-85. A “point” in hockey often accounts for 50-100% of the team’s final score, while a “point” in basketball accounts for about 1% of the team’s final score. When you have fewer scores happening in each game, this makes the outcome “lumpier”, and therefore more random.
Any other hypotheses? Does this make you think about your favorite sports any differently? Let me know in the comments.
[1] The nice thing about using win percentage is that it can be used anytime during the season and across sports, without the kinds of biases we saw with the Gini coefficient.
[2] A disclaimer about the methodology: I acknowledge that there is some circular logic to using win percentage as the dependent variable. After all, if there is a lot of randomness in a given sport, then the win percentages in that sport will be a less accurate measure of those teams’ quality… thus making the charts above look like there is even more randomness. There’s no good way to correct for this, so I’m going to just note it and leave it as is.
Any Given Sunday
“On any given Sunday, any team can beat any other team.”
-Bert Bell, NFL Commissioner, 1946-1959
We all love a good upset in sports. That’s why the NFL famously embraces the fact that any team could beat another team. But, this made me wonder: how does this compare across different sports? Are some sports more or less prone to upsets (or, in other words randomness) than others? I’m going to attack this question a couple ways.
Gini Coefficients
The first way to think about randomness in a sport is to look at how much inequality in wins there is between the good and bad teams. Great win equality should correlate with more randomness in a sport, (since it’s harder for the genuinely good teams to consistently beat the worse teams). And the most rigorous way to think about inequality is the Gini coefficient.
Gini coefficients are used by economists to measure inequality within a population. Basically, you sort the population from poorest to richest, and plot the curve of their cumulative wealth (shown as the blue curve below). You then compare that to a straight line (which would represent perfect equality). The ratio of the area between the curves (the red striped area) to the total area (red plus blue) is the Gini coefficient. So perfect equality would be a gini coefficient of 0, while perfect inequality would be a Gini coefficient of 1.0.
Figure 1: Illustrative Gini Coefficient
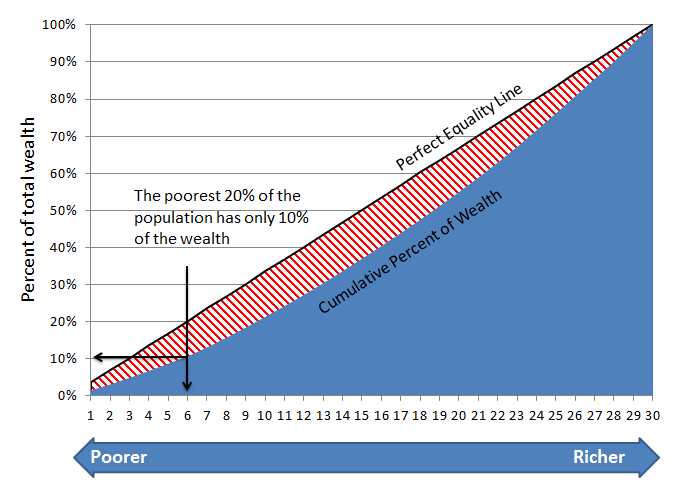
You may have noticed that the chart above has 30 points on the x-axis… that’s because these actually represent the 30 teams of the NBA, sorted by their 2010 win totals. So, for example, the bottom six teams that year (Minnesota, Cleveland, Toronto, Washington, New Jersey, and Sacramento) had a total of just 10% of the league’s wins.
The actual Gini coefficient for the NBA that year, or the red area divided by the red + blue areas, is 0.175 (or 17.5%). So, how does this compare to other sports?
Gini by Sport
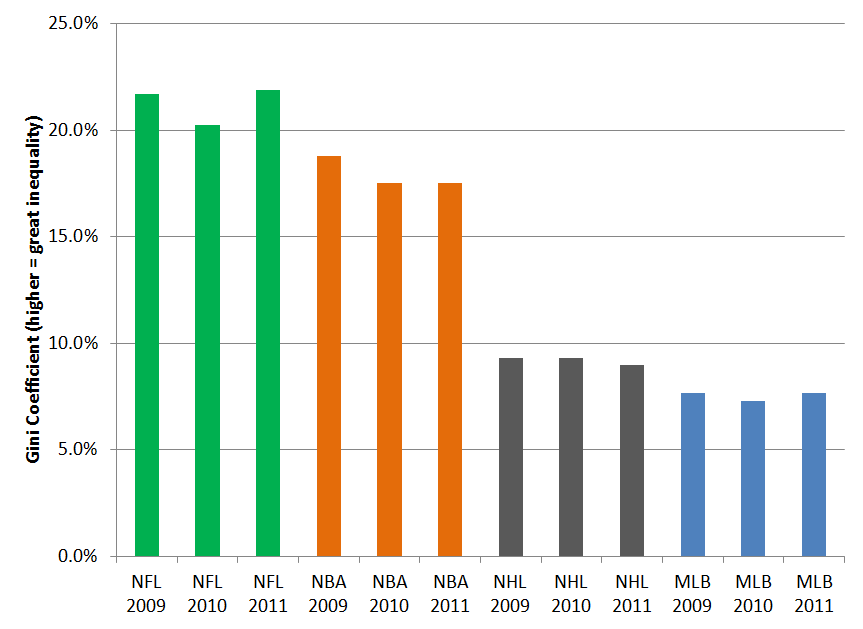
If we look at the Gini values by sport (see Figure 2 below), we can see a few interesting things. First, they’re all pretty low – all below 25% (in contrast, the US income Gini coefficient is around 45%). But there are also pretty significant differences between sports. In fact, based on the past three years for each league, there isn’t ANY overlap between the ranges of values. So there is the least disparity (indicative of more randomness) in baseball, followed by the NHL, then the NBA and finally, the most disparity / least apparent randomness in the NFL (ironic, given the claim about “Any Given Sunday”).
Figure 2: Gini Coefficients by Sport, Last Three Seasons
This analysis has a flaw, however.
Re-adjusting for Games Played
While they are really useful, Gini coefficients are particularly susceptible to measurement problems. And I’ve discovered a weak spot here: each league plays a different number of games. When you have a shorter season (like the NFL’s 16-game schedule), you have a greater chance for weird outlier events (e.g. win streaks from bad teams) to happen. With more games, you have more mean reversion.
This can’t be corrected empirically (say, by dividing by the number of games). But it is a perfect application for a Monte Carlo simulation, where you pull a smaller sample of games from the population, and re-calculate the Gini coefficients:
Figure 3: Games-Adjusted Gini Coefficients, based on Monte Carlo Simulations

Sampling smaller subsets of the MLB and NBA 2011 seasons, we can see that the Gini coefficients increase with fewer games, as expected. In fact, The NBA Gini coefficient with 16 games is 22% – right in line with the NFL Gini coefficients.
Conclusion
So, it looks like baseball has more evenness between teams, based on the distribution of wins. But in my next post, I’m going to look at this a different way, using a more head-to-head approach.
NFL passing yards record: by the numbers
I’m a numbers guy – and the only things better than solar numbers are sports numbers. So I’m going to reprieve my usual solar analysis for some sports analysis.
This year’s NFL season has a unique statistical race, as two quarterbacks (Drew Brees and Tom Brady) are on pace to break Dan Marino’s single-season passing record, and a third (Aaron Rodgers) is close.
Assessing the current stats
Both Brees and Brady are looking good for breaking Marino’s record. Through 13 games, they have 4,368 and 4,273 yards respectively. This puts them on pace for 5,376 and 5,259 yards each. They’re comfortably ahead of the record pace, by 5.7% for Brees and 3.4% for Brady.
 Another way to look at it: how many yards per game would they have to get in their final three games in order to just break Marino’s record? For Rodgers, it’s 320 yards for each of his remaining three games. For Brady, 270 yards per game. Drew Brees only needs 239 yards per game from here on out.
So they look good now. But I was still wondering whether there would be any other outside factors coming down the home stretch. So I pulled some more data to test two more hypotheses.
Hypothesis 1: are their remaining opponents going to be tougher to gain yards on?
Could it be true that these quarterbacks got to beat up on easier competition earlier in the season? In fact, even if all else was equal, you would expect their past opponents to have given up more passing yards, just because they’ve already faced these record-setting passers. And, more importantly, are their remaining competition going to be tougher to gain yards on?
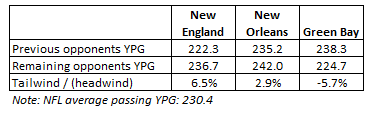
Happily for Brady & Brees, the answer is no. Brady’s last three opponents (Den, Mia, and Buf) have given up, on average 236.7 passing yards per game. This is 6.5% more than their previous opponents’ average. Similarly, Brees’ three upcoming opponents have given up 2.9% more than his previous opponents. So both of these guys are going to be facing slightly easier opponents down the stretch of their potentially record-setting run.
Unfortunately, Aaron Rodgers doesn’t have the same tailwind down the stretch. His last three opponents (KC, Chicago, and Detroit) have given up 5.7% fewer passing yards per game than his previous opponents.
Passing Yards Per Game, Previous vs. Remaining Opponents
Hypothesis 2: Do passing yards fall over time?
Is there any seasonality in passing yards? There are a bunch of reasons to think there might be seasonal trends:
- As the weather gets worse, it’s tougher for the skill-based passing plays to be effective.
- Over time, defensive secondaries might get better, particularly for zone defenses which require coordination and discipline.
- On the other hand, as the season goes on, the timing of quarterbacks and wideouts might improve, particularly for timing-focused plays like slants and outs.
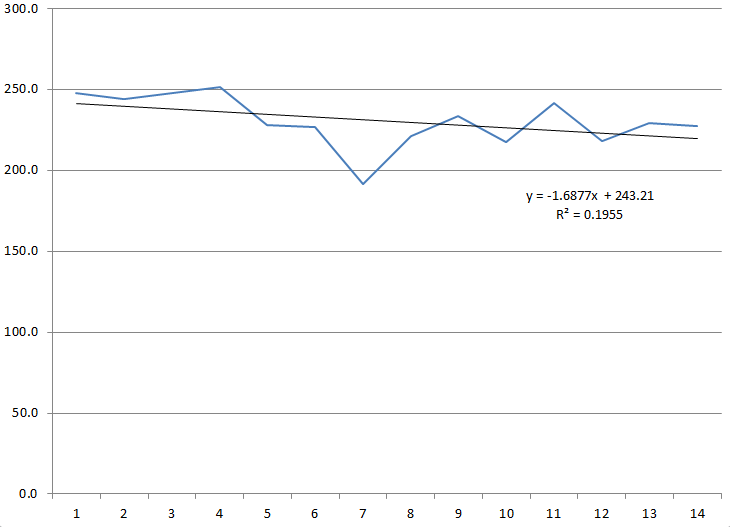
This year, through 14 weeks, there is a small downward trend in passing yards (see the chart below). On average, the teams pass for approximately 1.7 fewer yards each week. However, the R-squared value (.195) means that only about 20% of the weekly variation can be explained by the timing through the season.
Weekly Passing Yards per Game, 2011
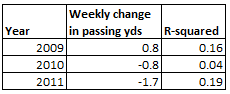
If we look at the last few years, though, the seasonality appears even smaller:
Weekly Passing Yards per Game – 2009, 2010, and 2011

When looking at all three years, the downward trend doesn’t seem as significant. In fact, 2009 actually had a slightly positive change in passing yards over time (+0.8 yards per week), while 2010 was just a negative (0.8) passing yards per week. It seems like there isn’t much seasonality to passing yards at all.
So all in all, it looks good for Brees and Brady. Both are strongly ahead of the record pace, both have easier competition down the stretch, and it doesn’t seem like the colder weather at the end of the season will significantly reduce passing yards. Now they just have to go out and play the games!
Cleantech Matrix
As I was recruiting for jobs a couple years ago, I wanted to make sure I had the entire solar industry dialed in. So, I set out to list out all venture-backed solar startups and cleantech investors. The project took on a life of its own, and I ended up with a decent summary of cleantech startups. So, now I want to share it with the world.
The “Cleantech Matrix” includes over 800 cleantech startups, and over 400 investors – with an “x” for investments. This can be downloaded, password-free, from the box.net tool on the right of this page. I’m hoping this will help job searchers find companies, or help entrepreneurs find investors.
Now, I haven’t been that diligent about updating this lately, so I may be missing a few dozen companies. Please let me know (either in the comments below, or at thegreenstalk@gmail.com), and I will update the file periodically.
Finally, a few random thoughts/comments:
- I have nothing against angel-funded or bootstrapped startups, but I used VC funding as my general rule for inclusion. (Plus, I was originally using this for my job search purposes, and I wanted to work at a venture-backed startup.)
- Sorry it’s somewhat America-focused. I’m happy to include more international startups if anyone has suggestions.
- I think there are a lot of cool things that can be done with this data (perhaps a wiki platform?), which is why I’m sharing it. Let the data be free!
Solar Debate: Power Electronics
This wraps up my “solar debates” series: descriptions of the topics that we debate in the solar industry, at conferences and over drinks. And this last one means a lot to me, because it is the sector that I work in: distributed power electronics.
Introduction
There are plenty of startups working to create better/cheaper/smarter versions of standard solar components – modules, inverters, racking, etc. But there is a category of startups working on technologies that represent a brand new part of the system: smart, module-level electronics.
The basic idea is to put smart boxes behind each solar module. These boxes increase the energy production of the system, and provide data on how each module is performing. To really understand this, it’s worth a quick review of how systems are designed today.
Solar architectures
Currently, an installer will connect all the solar modules (say, 2,000 modules on a commercial rooftop), into an inverter (the size of a small car), which optimizes the power and converts direct current (DC) to alternating current (AC). The problem with this approach is the central ‘optimization.” For example, if the 2,000 modules are not perfectly balanced, then the central optimization won’t be able to get the maximum power. Just a small amount of mismatch can lead to a big drop in power. Also, the system owner doesn’t have any idea what is happening inside the system. The inverter will tell what is happening overall, but doesn’t give any clue what each of the 2,000 modules is doing. If the system doesn’t perform well, it can be very difficult to find the problem.
Category value proposition
This new area has a number of pros, and a couple cons. First, the pros:
Increased energy: By keeping each module performing at its peak power point, these architectures can squeeze more energy out of a solar plant. On a residential system (where there are trees, rooftop obstructions, and other sources of shade), the increased energy could be 10-20%, or even more. On large, unshaded systems, the performance gain is more like 5-7%.
Advanced system data: With these architectures, system owners get data on how each module is performing. A system with 2,000 modules will have 2,000 sources of data, instead of one. This is useful for spotting failures and getting them fixed. Otherwise, small failures can go unnoticed for years. Not only does this keep system uptime higher, but it reduces risk, and therefore should eventually reduce the cost of capital for financing these systems.
Safety: These systems enable plant operators to shut off the power right at the module in the case of an emergency (such as a fire). This makes the rooftops safe for the firefighters to do their jobs.
And, the cons:
Cost: Of course, these systems cost money. The main cost is the cost of the hardware – but customers also factor in the incremental installation cost, if any… and typically the cost of the software.
Efficiency: Any time you have a piece of power electronics in your system, there will be some efficiency loss (even if it is small). So some of the increased energy from the module-level power control is eaten up by the losses from the components in the system.
Risk of failure: Anything can fail. And since these technologies represent a new layer of “stuff”, they also add more potential failure points to the system. This isn’t necessarily fatal – some technologies can fail to the “on” position, where a failure of the electronics won’t stop the module from producing. But it is still a factor.
The Architectures & Startups
A number of startups are all developing slightly different flavors of module-level power electronics. Overall, there are three dominant types:
| Name | Philosophy | Companies |
| Micro-inverter | Take the central inverter, and shrink it down to a much smaller size. Then, put the small inverter on the back of every solar module. | EnPhase
Petra Solar Array Converter |
| DC/DC series | Keep the central inverter, but put a small circuit board on the back of every solar module.
(The modules are still wired in series.) |
Tigo Energy
National Semiconductor SolarEdge Azuray Technology |
| DC/DC parallel (voltage boost) | Keep the central inverter, but put a box on the back of every solar module.
In addition to optimizing the power, the box also boosts the voltage, so each module is wired in parallel. |
eIQ Energy
Tigo Energy |
These innovations create a great arena for debates. Which architectures will win – and how ubiquitous will these components be?
Since I work in this sector, I’m of course biased. So instead of just picking winners, I’ll explain a few of my hypotheses for how this industry will evolve.
1) Micro-inverters do not scale
Micro-inverters do a lot of work (basically, convert DC to AC, and condition it for the grid). But for large systems, it doesn’t make sense to do all of those steps at each module. Many of the components (capacitors, transformers, etc.) are more efficient and cheaper the larger they get. This hypothesis is validated by looking at the costs of the systems: if you compare EnPhase (micro-inverter) to Tigo Energy (DC-DC maximizer), then EnPhase is cheaper for systems under 4kW, and Tigo + central inverter is cheaper for systems above 4kW. Furthermore, the projects validate this: Tigo has recently been installed on a 530kW system on the roof of Clif Bar in Berkeley, while eIQ Energy is developing a 1.8MW system in Southern California.
2) Parallel products have benefits, but come with a cost
Both DC architectures are good, but they have different pros and cons. The series architecture (for example, the Tigo ES Maximizer) has the advantage of being cheaper and more efficient, because it isn’t doing that much work. It’s a “least-intrusive” approach, which keeps the part count really low and the efficiency really high. The parallel approach, on the other hand, is more expensive and less efficient. These products are boosting voltage, often by as much as 10x. So they’re doing more “work.” Now, there are benefits to the parallel design: it’s flexible (for example, can incorporate multiple PV module types into the same inverter), and it offers galvanic isolation, which is safer. And with high-voltage modules (e.g. thin-film), the parallel approach can lead to a significant reduction in copper costs. However, a majority of systems don’t need the benefits of parallel – or, more specifically, the benefits aren’t worth the cost in hardware and efficiency.
3) These architectures can become popular on utility-scale projects, but must prove significant reliability and cost-effectiveness
Within a few years, I believe that module-level power electronics can be popular on the largest solar plants. These projects are much tougher to sell into – the system costs are lower, the profit margins are smaller, and the tolerance for problems (i.e. failures) is far smaller. They are also more likely to use project financing, where large banks have to approve the components – and they typically look for a 5-year track record as a minimum. I think that for module-level power electronics to take off at these systems, they must be very cheap – roughly $0.05/watt or cheaper. But in the next couple years, we can get there. In these systems, the value proposition will be more closely weighted toward data/O&M than simply energy harvest. These systems are managed very aggressively (from a maintenance/uptime point of view), and the module-level data can be hugely helpful to find failures and keep uptime high. The systems will probably drive more financial return from smarter system maintenance than they will from pure energy harvest. Of all of these hypotheses, this one is probably the most controversial – many smart people don’t ever think module-level power electronics belong on large-scale sites. Time will tell.
4) Regulation (particularly safety) can accelerate the adoption
There is growing momentum to make solar systems safer. The best way to do this is to shut off systems at the module-level (other approaches to shutting of a system still leave voltage on the cables, which is not safe at all). So if this keeps moving, we may see these types of architectures essentially mandated by the code/inspector community. The latest development here is the latest edition of the National Electric Code, section 690.11, which basically mandates module-level electronics, and went into effect in January 2011. There are still other things have to happen (including standards for how to test/validate that the equipment works), but this train is already in motion.
5) The data will give early adopters a competitive advantage
Many of the earliest customers of these technologies really see the data as the most important value of the power electronics. I believe that module-level data will become integrated into many aspects of how solar plants are built and managed: how performance is predicted, how the installation & commissioning process works, how the systems are maintained, how warranties are negotiated… and the leading companies will always be one step ahead of their competitors.
(Some brief self-promotion: we’ll be giving a webinar on this in May.)
6) Module-box integration is an important step – but it is a means, not an end
Everyone is watching for the next step of having the electronics integrated into the module to create a “smart module.” Right now these components are installed as separate components, which leads to increased labor and costs. By moving the circuit board into the module, a lot of these costs are eliminated. My only issue with this logic is that a lot of these startups think that their strategy is to exclusively work with module manufacturers. Basically, they want to just convince the module manufacturers to put their products into the modules, and then assume that the volumes will go from $0 to billions overnight. I don’t see the market playing out like that. The module manufacturers first want to see market traction before they will invest in integrating a component. So the startups have to build a solid stand-alone business before they will really be taken seriously by the manufacturers. Also, the module manufacturers won’t necessarily push the new smart module. Once again, the burden will be on the startup to generate the market pull for the product. We’re hoping that Tigo will be the first startup to have a fully-integrated smart module available, hopefully by Q3 of this year.
I love this stuff – this is the most cutting-edge part of the solar sector. And in the next couple years, my hypotheses will be proven or disproven. Stay tuned – in the meantime, I’ll share news below:
3/18/2011: A literal debate on this topic, last week
2/24/2011: More startups entering the market
1/20/2011: A nice profile of Tigo Energy
12/28/2010: Power electronics – #7 on the year in review
Job Search Advice
Getting a job in the solar industry isn’t necessarily easy. Most technology-heavy firms tend to have one or two business people for every dozen engineers. So in the interest of helping out those who are trying to break in, I wanted to share a few things I learned.
My story
My interest in energy didn’t start until relatively late. I started out studying math in college, and then spent four years in management consulting. I went to business school with the hopes of finding a career to focus in. I decided pretty early in grad school that I wanted to do energy, and took an internship with Abound Solar. I had an amazing time there, and then decided that solar was the industry for me.
I did a networked job search. Before this process, I never thought of myself as a networker. “Networking” seemed like a euphemism for pretending to like people you barely know, in the hopes that they will someday contribute to your political campaign. It turned out to not be as bad as advertised, but it took a lot of work. Here is my summary of how a networked job search works:
- Get introduced to someone.
- Meet with them over coffee, or have a phone call.
- Try to ask smart-sounding questions, talk about projects I’ve been working on.
- At the end, ask them if they know anyone hiring, and ask them to connect me with other people who I should meet.
- Repeat.
This job search continued the entire second year of my MBA program. I flew to the Bay Area every 6 weeks, crashed on couches, and tried to meet as many people as possible. I read the news; I also read patents about companies that I wanted to learn more about and companies I was meeting with. I did projects – I worked for free (or nearly free) with two Boston startups (one a water startup, another one a waste heat technology). These gave me things to talk about during the networked job search, and they helped me get smarter about how things actually worked in energy startups.
Eventually, I landed a job offer. That fateful day, I went from first meeting the team to a handshake offer in under five hours. I had spent nearly 12 months with nothing to show for it, and then closed an offer in half a day. By the time I found this job, I had met with 118 people.
Lessons Learned
1. Burn the boats
If you’re not all-in on the industry, then your odds of success are really low. I’ve known a bunch of people who were half-trying to get into solar. Their success rate so far is 0%. Stop considering jobs at McKinsey or Google. You have to live & breathe your future industry, or you won’t get traction.
2. Pick a specific sector as early as possible
You might think of it all as “cleantech,” but nobody in the industry calls it that. Solar people work in the solar industry. And solar has very little in common with other sectors (water, wind, biofuels, etc.). The sooner you narrow down to the sector you enjoy most, the deeper you’ll be able to go in becoming an expert in that sector. You don’t have to be ultra-specific, but you should be making your solar/smart grid/water/electric vehicles decisions as soon as you can.
3. Tell your personal network – they’ll help you
Now that you’ve burned your bridges, let everyone know. Tell your friends from school, your friends from previous jobs, and your family. They will bring you job leads.
4. Consider working for free at first
When you don’t have any experience, the best thing to do is get some. And that often involves working for free. It may be difficult to find a role at first. You may have to start with some unglamorous projects, and eventually can help out with business plans, financial models, or work planning. My first project was simply doing paperwork for a government grant application – as unglamorous as it gets. But I liked the team, and it proved that I was willing to do whatever needed to get done.
5. Startups don’t need “strategy” help
Sure, you’re an MBA. And you used to work for McKinsey. But startups don’t need someone to put their issues into a 2×2 matrix. Earn respect by doing menial work (see the point right above this), and by learning the technology and the market. If you’re a generalist, then expect to do a lot of business development (which usually means cold-calling potential customers or partners).
6. Read patents
There is a ton of information out there if you’re willing to look for it. Most companies have patents that can tell you a lot about the company’s technology. And they’re public domain – fair game for anyone to read. I use patentlens.com, but any patent search would do the job. Be warned – it’s tedious reading. But you will learn things that very few people know about. And it differentiates you from other job seekers.
7. Get some networking momentum
Everyone has to start somewhere. The first five conversations you have are going to be pure charity. You’re going to have people putting information into your head, while you have nothing to offer in return (except for your gratitude). It’s difficult at first. Eventually, you’ll start to have a good enough network, and a good enough grasp of the industry, where you can help people out – whether it’s an introduction or a heads-up on a new technology. This is a big turning point:
a. The job search becomes more fun. It’s always nice to feel like you’re helping other people. This creates a positive feedback loop (your confidence makes you more effective).
b. You get taken more seriously. When you sound like you know what you’re talking about, people assume that you’re really going to end up in the industry.
8. Don’t forget the junior people when networking
Senior people may have tons of experience and heavy-hitter contacts… but they have very little time to help you out. Junior people make up for their lack of seniority with their willingness to help. I got way more help from people my own age than I did from people my father’s age.
9. Hit the road
If you want to work at a Silicon Valley startup, then you have to come out to the valley on a regular basis. Early-stage startups don’t have a hiring budget – so they don’t travel. And they don’t hire over the phone. Do the math.
10. Try to have fun – because you have to do work where the payoff isn’t clear
I genuinely found the solar industry really interesting. This was important because I was then willing to do work even if I wasn’t positive that it was worth it. It’s difficult to convince yourself that reading a patent (or ten of them) will lead to a new job. But if you can find a way to enjoy reading the patents, then the professional value just becomes a bonus.
Back in action
It’s been a few month delay, but I’m finally getting the blogging going again.
In the last few months I have changed jobs, from one power electronics company to another one. In addition to being a touchy situation (going to a competitor), my new job also slammed me pretty good with work. I’m finally starting to catch up.
The next post is going to be a little different, writing about job search strategies. This is mainly because I am coordinating with the editorial team at Renewable Energy World, and they will be airing a podcast soon that includes some of my thoughts on how I approached my job search. But after that I’ll be back to my usual solar analysis/commentary.
Five Solar Debates: the Efficiency Race
CdTe and CIGS are the two new kids on the block for thin-film solar. Both technologies promise rock-bottom manufacturing prices, and respectable efficiencies (10% or greater). First Solar’s CdTe modules have given them a $10Bn market cap and pole position in the industry, while a number of high-flying CIGS and CdTe startups chase them.
First Solar may have all the manufacturing scale, but there is still a measure on which these technologies are still competing very closely: efficiency. Higher efficiencies are huge because the same amount of glass & aluminum provides more power – and since modules are priced based on their power, that extra money goes straight to the bottom line of the manufacturer.
Bandgap background
To understand what will determine efficiency, we have to dive into physics for a moment. I’ll keep it quick. Photons from the sun come in a wide range of wavelengths – this is what gives us the color spectrum.

Solar Spectrum
So the solar cells are tasked with absorbing that spectrum of light. Ideally, they would absorb the entire spectrum – but in reality, there are a host of constraints (e.g. shading, reflection, and recombination) that reduce the amount that a cell can absorb.

Source: Newport Spectra-Physics GmbH
CdTe and CIGS have been selected because their bandgap efficiency is very good, so a very thin layer can capture much of the sun’s energy. This is where they get the name “thin film.” (One interesting thing in the chart below: notice how the thinner CdS layer (which is physically in front of the CdTe) improves the cell efficiency. This illustrates the shading phenomenon – just a small taste of what the folks at First Solar and Abound are working on…)

CdTe efficiency spectrum, from Reuben Collins
What is efficiency, anyway?
You might be asking what “10% efficiency” means. It’s actually way simpler than you think. “Full sunlight” (noon on a summer day), means that a square meter of earth at sea level is hit with 1,000 watts of energy. A nice round number. So to put it mathematically, a full sun is equal to 1kW / m^2.
Efficiency is therefore a measure of the amount of sunlight that a module can absorb at full sun. A 10% efficient module that is exactly 1 square meter large would generate 100W in full sun (1,000W x 0.10). Using real numbers: a First Solar module is 1.2m x 0.6m (0.72 square meters). If it generates 80 watts at peak power, that module is 11.1% efficient (80W/(0.72 square meters*1000)).
The Debate
The efficiency race between these two technologies has been close for decades (see the chart below). Both have a theoretically maximum efficiency of about 30%. CIGS advocates brag that CIGS has the highest lab efficiency (19.9% efficient). However, it was done using an intensely complex process: quadruple sublimation (essentially, evaporating four different components at the same time, at very precise levels). This process was so complex, in fact, that no company is seriously trying to commercialize it.
CdTe has a lower champion cell, but it is much simpler to manufacture. Its bandgap (1.4 eV) is almost perfectly tuned to capture the most sun with the least material.

Champion cell, CIGS vs. CdTe (with a-Si pulling up the rear)
[Again, a disclaimer: I used to work at a CdTe startup.]
So what do the companies have to say? What is being produced out of real factories? We can look at available datasheets to see the efficiencies promised:
| Company | Material | Size | Power | Efficiency |
| First Solar | CdTe | 0.72 m^2 | 70W – 80W | 9.7% – 11.1% |
| Nanosolar | CIGS | 2.0 m^2 | 160W – 220W | 8.0% – 11.0% |
| Wurth | CIGS | 0.73 m^2 | 70W – 80W | 9.6% – 11.0% |
| Solyndra | CIGS | 1.97 m^2 | 150W – 200W | 7.6% – 10.2% |
| Stion | CIGS | 1.10 m^2 | 110W – 130W | 10.0% – 11.8% |
Pretty close, huh? That’s why it’s still an open debate. Physicists tend to predict that CIGS will eventually win – the lab efficiency is so much higher! But manufacturers have a healthy respect for the simplicity of CdTe; First Solar may keep the thin-film efficiency crown for years to come, through their manufacturing prowess. And only time will tell.
One last caveat on cell efficiency: don’t mistake cell efficiency for module efficiency. Module efficiency is always lower – often by 10-20%. (An analogy: cell efficiency is sort of like highway MPG, whereas module would be city MPG.) There are a bunch of reasons for this difference: resistance in the module, mismatch across cells, or shading from the front electrodes. Cell efficiency is still important – but module efficiency is what you’ll actually get in the real world.

1 comment